A coffee machine’s simple payback depends on the investment you count and the operating surplus available to recover it. There is no single number that applies to every café. Sales volume, drink prices, ingredients, staffing and premises costs all change the result.
The ITOP café payback calculator lets you explore those assumptions. This guide explains how to enter a consistent set of figures, read the calculation and test a slower-sales case. The example covers an espresso service as a whole; it does not measure profit created by one machine.
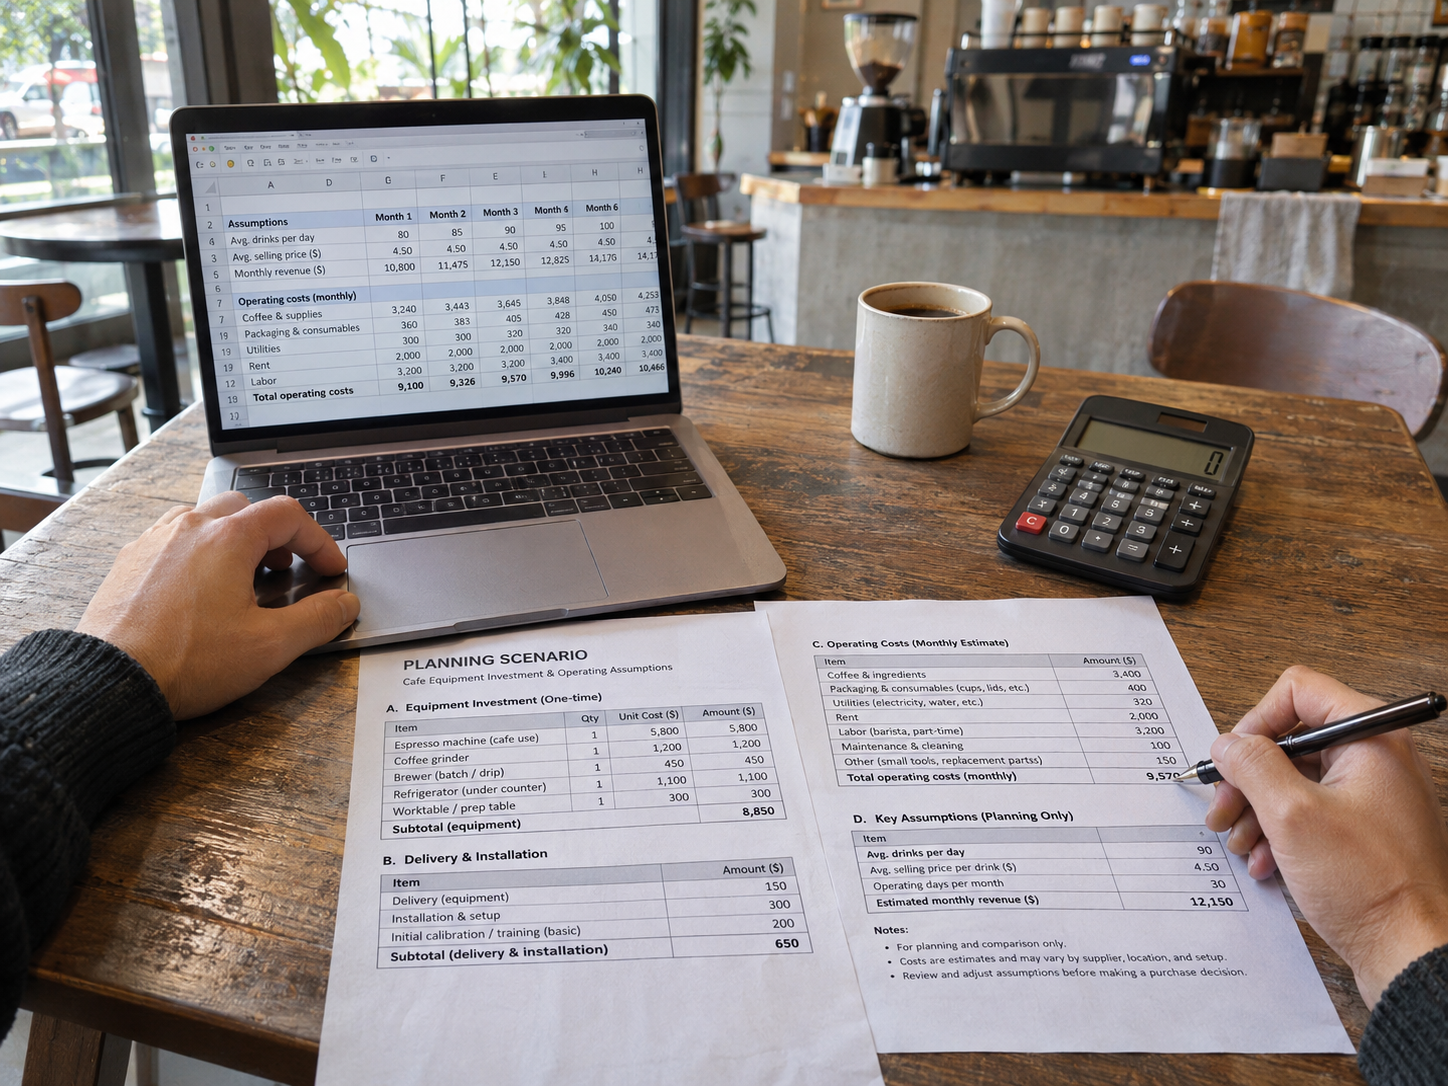
Start with a clear description, such as “espresso equipment, accessories, delivery and installation for our café counter.” Collect the costs needed to put that setup into use. Check what each quotation includes before adding freight, accessories or installation again.
A full café opening investment may also include a lease deposit, building work, furniture and pre-opening expenses. If those are excluded, the result describes recovery of the selected equipment-and-setup amount, rather than the whole opening investment. Keep a cash reserve separate from expenses already counted.
The U.S. Small Business Administration’s planning guidance separates one-time startup costs from recurring expenses. That is a useful organising principle; your actual amounts come from your quotations and operating plan.
If your equipment list is still taking shape, use the coffee shop equipment checklist first. The calculator cannot establish which configuration will handle your menu or peak workload.
Choose an ITOP machine as context for the equipment you are considering. Selecting a model fills in its displayed equipment price, before shipping and taxes. Replace that amount with your defined total when modelling equipment and setup together. The selector also includes “Example: café espresso machine (illustrative).” That example is a planning option, not a product quotation.
| Tool field | Your planning input |
|---|---|
| Avg cups/day | Cups sold by the service you are modelling, including a lower-sales case |
| Avg price/cup | Average selling price using the same expected drink mix |
| Operating days/year | Days on which that service will trade |
| Equipment cost | The defined initial investment, including setup costs you choose to model |
| Annual operating cost | Annual costs that have not already been deducted through the margin assumption |
| Financing term | The 24-, 36-, 48- or 60-month period used for the displayed simple ROI |
| Machine-driven margin | The editable revenue-share assumption inside “How we got this” |
The “Machine-driven margin” starts at 8%. It is an allocation assumption, not a measured machine contribution or an industry profit rate. Define what your percentage represents and which costs it already removes. The result labelled “Annual profit impact” follows that assumption; it does not establish what the machine caused.
Annual revenue = cups per day × average price × operating days.
Estimated annual balance = annual revenue × (chosen percentage ÷ 100) − annual operating cost.
Simple payback, months = equipment cost ÷ (positive annual balance ÷ 12).
Simple ROI over the selected period = [(annual balance × years) − equipment cost] ÷ equipment cost × 100.
Here, “Financing term” selects a calculation period. The tool does not calculate interest, repayments or loan amortisation. Its simple ROI also leaves out income tax, discounting and resale value.
Hypothetical example: an espresso service has a $4 average selling price and $1.50 variable cost per cup. That leaves $2.50 per cup before other operating costs. Its contribution rate is ($4 − $1.50) ÷ $4 = 62.5%.
For this model, enter 62.5% in “Machine-driven margin,” $36,000 in annual operating cost, 300 operating days and $7,500 equipment cost. In this worked example, we use that percentage field for the service’s contribution rate, rather than a measured share generated by a selected machine. The $36,000 represents the service’s other annual costs; the $1.50 per-cup costs are already removed by the contribution rate. Select 36 months for the three-year comparison.
All these figures are invented teaching inputs. They are not an ITOP quotation, a typical café budget, a customer result or evidence supporting the default 8% assumption.
| Calculation | 40 cups/day | 60 cups/day | 80 cups/day |
|---|---|---|---|
| Annual revenue | $48,000 | $72,000 | $96,000 |
| Revenue × 62.5% | $30,000 | $45,000 | $60,000 |
| Other annual operating costs | $36,000 | $36,000 | $36,000 |
| Estimated annual balance | −$6,000 | $9,000 | $24,000 |
| Simple payback | No positive payback (“Not yet”) | 10 months | 3.75 months (tool: 3.8) |
| Three-year simple ROI shown by the tool | – (not displayed) | 260% | 860% |
The balance belongs to the whole defined espresso service. The payback row shows how long that balance would take to equal the $7,500 equipment-and-setup amount. It does not measure a machine’s independent earnings or recover other opening investment that was excluded.
The tool shows “Not yet” for payback and a dash for ROI when the annual balance is zero or negative. Positive payback is rounded to one decimal place: 3.75 months appears as 3.8. The shorter payback in the higher-sales case follows from the same arithmetic; it does not prove that demand, staffing or equipment capacity will match the assumptions.
Use recipe and purchasing records to estimate average variable cost. For a mixed menu, weight prices and costs using the same drink mix. Put each expense in one place: either inside the contribution calculation or in annual operating cost. Keep all amounts on a consistent currency and tax basis. The current calculator displays USD; obtain a current quotation and convert your local costs consistently.
Build lower, expected and higher-sales cases. Change staffing, utilities or maintenance costs when the workload changes them. Include opening ramp-up in a separate cash schedule: annual surplus divided evenly across twelve months does not predict the month your actual cash balance recovers.
Use the peak-period equipment test to check the proposed setup against your drink mix; keep the observed workload separate from the sales forecast used in the calculator.
Before committing, confirm the site work and quoted configuration. The voltage and plug guide helps collect electrical information. The first-order and sample checklist supports the quotation and sample discussion.
Try the café payback calculator
For configuration and pricing, discuss your café equipment requirements with ITOP. Send your equipment scope, quantities, destination and site information so the team can clarify its quotation.
No. It is the tool’s starting allocation assumption. In the example, 62.5% is derived from stated selling price and variable cost, before other costs. Neither percentage establishes your café’s net profit margin.
There is no positive simple payback under those assumptions. Check the inputs, scope and cost allocation, then test whether a different operating plan changes the result.
No. Under the example assumptions, $36,000 ÷ ($2.50 × 300) gives 48 cups per day to cover the listed operating costs. Recovering the initial investment requires a positive balance beyond that level.
Compare its additional investment with evidenced changes in operating costs or contribution. The café’s existing sales and total surplus cannot all be credited to the replacement.